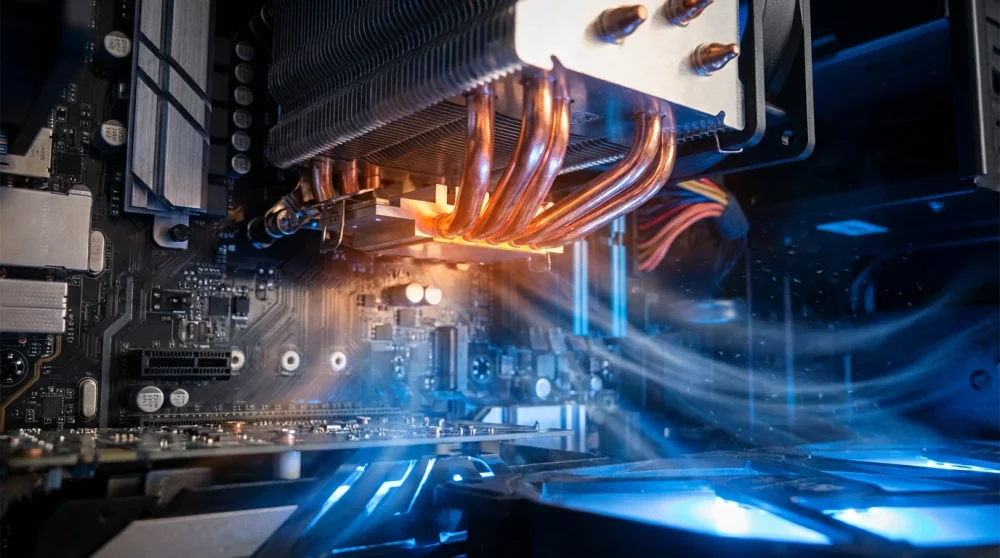
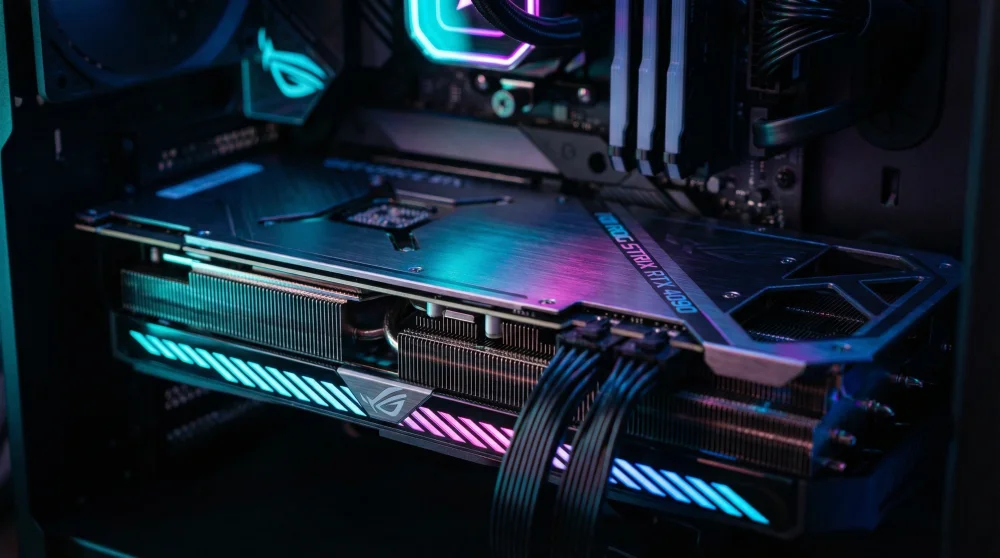
Is your computer fan spinning loudly like a jet engine preparing for takeoff? Or maybe your system feels sluggish during simple tasks? Unlike the GPU temperature, which Windows Task Manager happily displays in the Performance tab, the CPU temperature is surprisingly missing from native Windows interface.
Knowing your processor's temperature is critical for the longevity of your PC. Excessive heat can throttle performance and even shorten the lifespan of your hardware. While Microsoft hasn't added a simple temperature gauge yet, there are secure ways to check this vital stat, both with and without installing third-party software.
Native Method: Checking CPU Temp Without Software (PowerShell)
Many users ask if Windows can show CPU temperature natively. The answer is yes, but it requires a bit of digging into the command line. This method is ideal if you are in a restricted environment where you cannot install new software, or if you simply prefer a cleaner system.

We will use PowerShell to query the thermal zones of your motherboard.
- Open PowerShell as Administrator: Right-click the Start button and select Terminal (Admin) or PowerShell (Admin).
- Enter the Command: Copy and paste the following command into the window and press Enter:
wmic /namespace:\\root\wmi PATH MSAcpi_ThermalZoneTemperature get CurrentTemperature
How to Read the Result: The result you see is likely a large number like 3010. This is not degrees Celsius. It is the temperature in Kelvin multiplied by 10.
To get Celsius: (Result / 10) - 273.15
Example: If the result is 3010
3010 / 10 = 301
301 - 273.15 = 27.85°C
Important Note: This method relies on the motherboard exposing specific thermal sensors to the Windows Management Instrumentation (WMI). On many modern Ryzen or Intel Core systems, this command might not return any data or might show a static value. If this native method fails for you, using a lightweight, dedicated tool is the most accurate solution.

The Best Safe & Free CPU Temperature Monitors
If the command line feels too clunky or didn't work, specialized software is the standard way to monitor heat. However, the internet is full of outdated or bloatware-filled tools. Here are the safest, most modern options for [year].
1. HWMonitor (Best for Overview)
This is widely considered the gold standard for quick diagnostics. It doesn't just show the CPU temperature; it lists voltages, fan speeds, and usage for every component in your PC.
Pros: Lightweight, displays min/max values automatically.
Cons: The interface is purely text-based (no graphs).
2. Core Temp (Best for Minimalists)
Core Temp is laser-focused on one thing: your processor. It resides in your system tray and uses very few resources.
Warning: During installation, pay close attention. The installer often includes checkboxes for sponsored offers or extra games. Uncheck these to keep your system clean.
Feature: It shows the temperature of each individual core, which is great for spotting uneven cooling.
3. MSI Afterburner (Best for Gamers)
If you want to see your temperatures while you are gaming, this is the tool. Its On-Screen Display (OSD) feature projects your CPU and GPU temps into the corner of your screen so you can monitor heat spikes during intense gameplay.
What Is a Normal CPU Temperature?
Seeing a number is useless if you don't know the context. Use this reference table to evaluate your system's health.
- Idle (Desktop, Browsing): 30°C – 50°C This is the healthy range when you are doing light work. If you are sitting at 60°C+ while doing nothing, something is wrong with your cooling or background processes.
- Under Load (Gaming, Rendering): 60°C – 80°C It is perfectly normal for modern CPUs to reach these temperatures during heavy tasks.
- Danger Zone: Above 90°C Once you cross 90°C, your CPU will likely throttle (slow down intentionally) to protect itself. If you hit 100°C, the PC may shut down automatically to prevent permanent damage.
How to Lower High CPU Temperatures
If you find your system is constantly running hot, here are the most effective physical and software fixes:
- Clean the Dust: The number one enemy of electronics. A can of compressed air blown into your heatsink and fans can drop temperatures by 10-15°C instantly.
- Check for Malware: Viruses often run heavy calculations in the background (like crypto mining), heating up your CPU. If you suspect your system is compromised, booting into Windows Safe Mode is a great way to check your temperatures without background interference. If the temps are low in Safe Mode but high in normal Windows, you likely have a software issue.
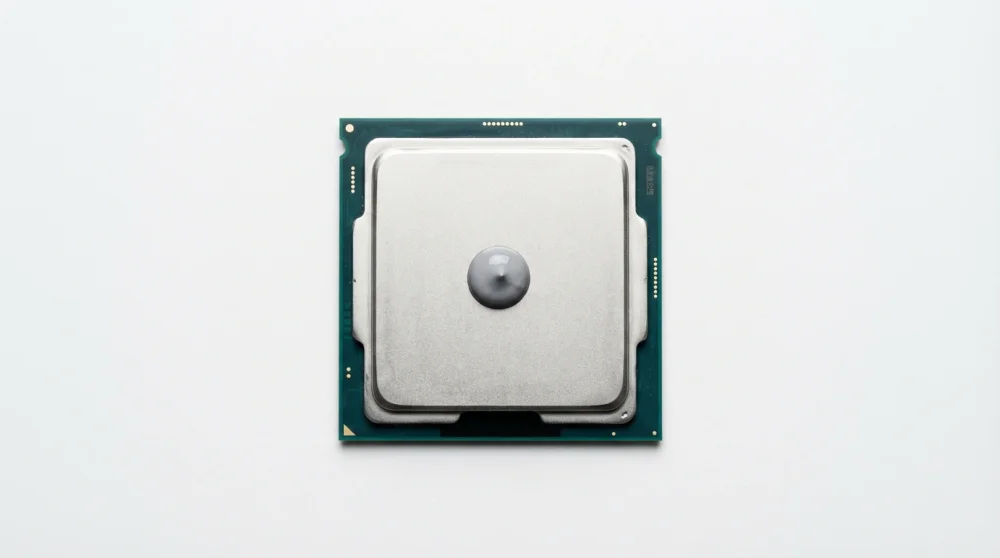
- Refresh Thermal Paste: If your PC is older than 3 years, the thermal paste between the CPU and the cooler may have dried up. Re-applying a pea-sized amount of quality paste can work wonders.
- Improve Airflow: Ensure your case fans are oriented correctly. You want cool air coming in from the front/bottom and hot air exhausting out the back/top.
For users who manage multiple operating systems, monitoring hardware can be different across platforms. If you are dual-booting and need to navigate the file system to check logs or config files on the other side, our guide on how to find a directory on Linux might come in handy.


