Running database load tests in JMeter's GUI mode while blasting a single static SELECT query will only benchmark your query cache and crash your local machine's memory. Genuine performance engineering requires simulating dynamic production traffic through properly sized connection pools and executing entirely via the command line.
| Component | Expert Recommendation |
|---|---|
| Execution Mode | Strictly Non-GUI (CLI) |
| Prerequisite | Database-specific JDBC Driver JAR |
| Target Metrics | p95 and p99 Response Times |
| Payload | Dynamic variables via CSV Data Set Config |
| Pool Sizing | Exact match to the production app's pool size |
The Baseline Test: Why Single-User Metrics Matter First
Skipping straight to 1,000 concurrent users makes pinpointing latency sources impossible. Run a single-thread execution first to establish your baseline network and query execution time.
If a query takes 500ms for a single user, dumping massive load on it will only amplify a fundamental indexing or schema flaw, not a concurrency issue.
Step-by-Step JMeter JDBC Setup
Adding the Correct JDBC Driver
JMeter does not ship with native database drivers to keep its footprint light. Download the exact JDBC driver JAR file matching your target database engine and version, such as mysql-connector-java.jar or postgresql.jar.
Drop this file directly into JMeter's /lib directory and restart the application completely. Skipping the restart guarantees a Cannot load JDBC driver class error.
Configuring the JDBC Connection Configuration Element
This element dictates how JMeter connects to your database. Assign a clear, memorable variable name in the Variable Name for created pool field.
Input your JDBC URL, driver class name, username, and password accurately based on your target environment.
Connection Pool Sizing: Matching Your Production Environment
Leaving the Max Number of Connections at the default zero causes JMeter to spawn a new connection for every single request, instantly exhausting database resources. Match this value exactly to the connection pool size of the production application you are simulating.
Testing a 500-connection load against a database tuned for a 50-connection app pool creates an artificial bottleneck that will never occur in reality.
Solving the "No Pool Found Named" Error
This is the most common roadblock during initial configuration. The error means the JDBC Request sampler cannot find the connection pool you defined earlier.
Check the Variable Name Bound to Pool in your JDBC Request and ensure it matches the Variable Name for created pool in the configuration element exactly. Case sensitivity strictly applies here.
Creating Realistic Load with SQL Parameterization
Using CSV Data Set Config for Dynamic Queries
Testing with a hardcoded SELECT * FROM users WHERE id = 1 forces the database engine to serve the result directly from memory cache after the first hit. This tests the RAM, not the actual database I/O or CPU capacity.
Attach a CSV Data Set Config element to feed unique IDs or search terms into your test plan. Write your JDBC Request as SELECT * FROM users WHERE id = ?, select Prepared Select Statement, and pass your CSV variable in the Parameter values field.
This forces the database engine to parse, plan, and execute every single query independently.
Set the Recycle on EOF option to True in the CSV Data Set Config so JMeter loops back to the beginning when it exhausts the file, instead of stopping mid-test with a missing variable error.
Execution: Why Non-GUI Mode is Mandatory
The graphical interface of JMeter consumes massive amounts of heap memory to render real-time graphs and listener trees. Pushing heavy loads through the GUI will trigger out-of-memory exceptions on the load generator machine long before the database breaks a sweat.
Always save the .jmx test plan and execute it via the terminal:
jmeter -n -t test.jmx -l results.jtl
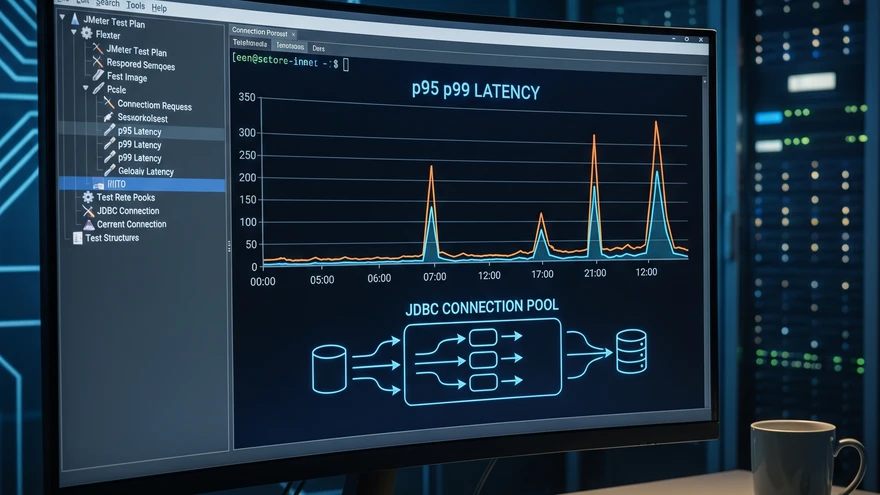
Analyzing Metrics: Why Averages Lie and p99 Matters
Looking at the average response time masks disastrous performance spikes. If 99 queries take 10ms and 1 query takes 5,000ms, the average looks healthy, but that one user experienced a total system failure.
Focus entirely on the p95 and p99 percentile metrics in your aggregate reports. These numbers reveal the true latency experienced by the most heavily impacted users during peak traffic surges.
Identifying the Bottleneck: App, Network, or Database?
High response times in JMeter do not automatically indicate a database flaw. Compare the JMeter latency metrics against the database engine's internal slow query logs.
If JMeter reports 2,000ms but the database logs show the query executed in 50ms, the bottleneck resides in network latency or connection pool exhaustion, not the query itself. Fix the plumbing before touching the schema.